- Courtesy of Computational Story Lab
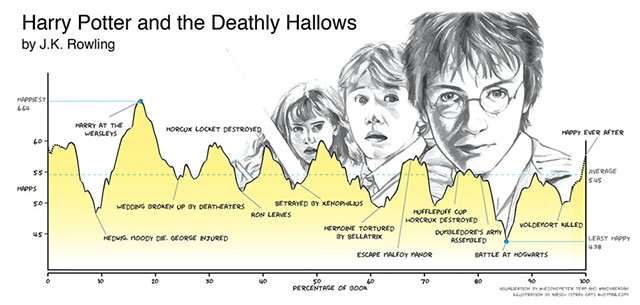
- Mapping the emotional arc of Harry Potter
At the University of Vermont, researchers in the Computational Story Lab can, within seconds, graph the emotional arc of any story — and provide its happiness ranking, to boot. How? With a complex and extremely precise computer program developed by PhD candidate Andy Reagan and advisors Chris Danforth and Peter Dodds. The last two are codirectors of the lab and professors in the College of Engineering and Mathematical Sciences.
Why study stories from a mathematical perspective? Perhaps the most succinct answer comes from a blog post Reagan wrote on the lab's website last month:
Stories help us encode and understand our collective existence, underpin cultures, and help frame the possible. Describing the ecology of all human stories is an essential scientific enterprise.
One of the most prominent findings of the group's research is that the emotional arc of most human narratives — defined as the trajectory of overall positive and negative feelings — fits one of six distinct shapes.
While such numerical analysis of stories may seem better fitted to mathematicians than to creative types, Reagan pointed out that novelist Kurt Vonnegut actually pioneered the idea. His blog post includes a delightfully irreverent 1985 video of the author illustrating basic story shapes. In it, Vonnegut declares facetiously, "Computers can now play chess, so I don't know why they can't digest this very difficult curve I'm going to draw now."
More than 30 years later, it seems, computers and their users are getting up to speed.
How does the UVM team turn the happiness of a story, or parts of a story, into numerical values? By analyzing it at the word level. To begin, they decided to create an emotional ranking system for a large quantity of words. They arranged for 10,000 of the most frequently used words, in 10 different languages, to be rated by 50 people on a happiness scale of 1 to 9.
Why not a more conventional 1-to-10 scale? For calculation purposes, Danforth said, there had to be a neutral middle value. The words with the happiest ranking, Reagan noted, are "love," "laughter" and "happiness."
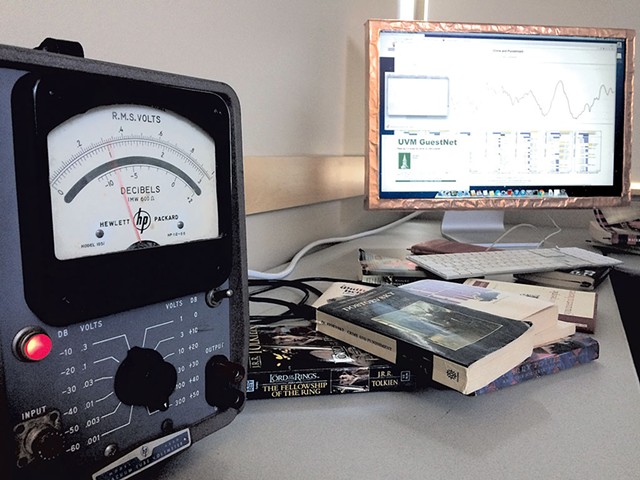
To plot out what Reagan called a story's "emotional signature," the researchers calculate the happiness average of a story segment using the rankings and occurrence of particular words. For statistical viability, segments are approximately 10,000 words long. So the happiness average of pages 1 through 20 of a novel is plotted beside the average for pages 2 through 21, and so on — overlapping to provide the richest analysis possible. As Danforth put it, "the instrument is about trying to rigorously quantify differences in word usage."
Once the researchers had this system in place, they began using it on books — a lot of them. They sourced more than 1,700 works of fiction from the Project Gutenberg website and charted their emotional trajectories. Each story fit roughly into one of six basic categories: rags to riches (steady rise), tragedy (steady fall), man in hole (fall rise), Icarus (rise fall), Cinderella (rise fall rise) and Oedipus (fall rise fall).
So, Romeo and Juliet? Tragedy, duh. Alice's Adventures in Wonderland? Rags to riches.
"[We're trying to] understand, at a deep scientific level, what the creative process produces," Danforth said. He readily admitted that the research has received some pushback. "There's a resistance among communities of people who've had a bad experience with math, or are less inclined to think scientifically about literature," he said, and added, "This is a fair reaction to have."
- Courtesy of Computational Story Lab
In general, though, the team has been reaping the fruits of its labor. Most recently, Reagan and company shared their work at the UVM Computer Science Fair — and received the award for top research project. Their research has also received attention from the New York Times, the MIT Technology Review and many other outlets, and will be featured in the February issue of Scientific American.
Lending mathematical validity to Vonnegut's thesis is not the only application for the work of the Computational Story Lab. With the help of social media, it can be used to gauge a society's mood at a particular historical moment.
Before the UVM team started working on story arcs, they formulated the Hedonometer — a website that measures the average happiness of Twitter as a single entity. In 2016, high points were Valentine's Day, Mother's Day and Thanksgiving. Low points included the Brussels terrorist attacks; the death of pop star Prince; the shootings of Alton Sterling, Philando Castile and five Dallas police officers; the election of Donald Trump as U.S. president; and — the lowest point of all — the Pulse nightclub shooting in Orlando.
Other Story Lab initiatives in progress involve predicting mental health using a person's Instagram feed, and studying correlations between the social media output and physical health of a given demographic using something called the Lexicocalorimeter.
"This is the very beginning of a new field: computational social science," Danforth said.
How the field might interact with the structures of corporate and governmental surveillance is another story.
In the era of social media and big data, the line between a quantitative and qualitative analysis of human behavior has become thinner. "We don't just have to think up theories," Danforth said, "[because] there's so much data being produced by our behavior — now we can actually let the data speak for itself." And one thing is certain: We can no longer perpetuate the myth that math majors don't care about emotions.


Comments
Comments are closed.
From 2014-2020, Seven Days allowed readers to comment on all stories posted on our website. While we've appreciated the suggestions and insights, right now Seven Days is prioritizing our core mission — producing high-quality, responsible local journalism — over moderating online debates between readers.
To criticize, correct or praise our reporting, please send us a letter to the editor or send us a tip. We’ll check it out and report the results.
Online comments may return when we have better tech tools for managing them. Thanks for reading.